
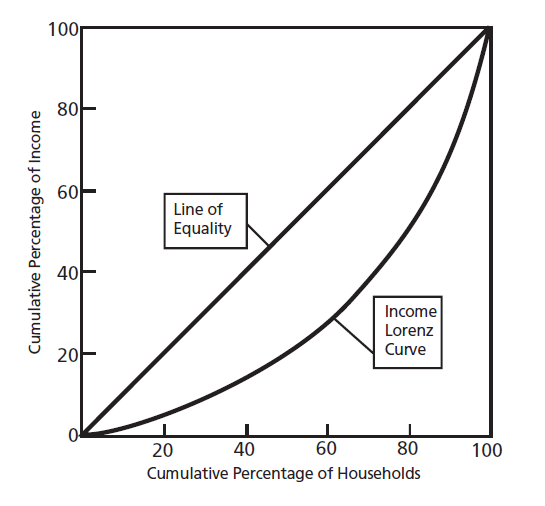
The Gini index is a commonly used measure of inequality in the distribution of income, wealth, consumption, and other economic variables—although it can be used to calculate inequality of anything that can be measured. It was developed by the Italian statistician Corrado Gini and published in his 1912 paper “Variabilità e mutabilità” (“Variability and Mutability”). It is defined as 100 times the Gini coefficient, which is the ratio of the area inside the Lorenz curve to the area under the line of perfect equality. The Lorenz curve graphically shows the distribution by plotting the cumulative percent going to the bottom x percent of the population. The Lorenz curve for U.S. income data from 2005 shows that the poorest 20 percent of households earn 3.5 percent of the pre-tax/pre-transfer income, while the poorest 40 percent (which includes the bottom 20 percent and the next poorest 20 percent) collectively earns 12 percent of income.
Thus, a lower Gini index indicates more equality. The lowest possible value of the Gini index is 0, in which case the Lorenz curve lies on top of the line of perfect equality and everyone has exactly the same amount. The highest possible value of the Gini index is 100, in which case the Lorenz curve lies along the horizontal axis and one person has everything, while the others have none.
The Gini index is useful because it condenses the entire distribution into a single, unitless measure that can easily be compared over time, across groups and countries and across economic (and noneconomic) variables.
World Bank
The most widely cited Gini estimates are from the World Bank’s World Development Indicators. Using data from recent years, the World Bank estimates that the most economically equal countries in the world— with income Ginis below 30—include many smaller European countries such as Austria, Bulgaria, the Czech Republic, Hungary, and all the Scandinavian countries, as well as Germany, Ukraine, and Japan. In the low to mid 30s are Australia, Bangladesh, Britain, Canada, Egypt, Ethiopia, France, Indonesia, Italy, Pakistan, Poland, South Korea, Spain, and Vietnam. In the high 30s and low 40s are India, Iran, Israel, Kenya, Morocco, Russia, and Thailand.
The average Gini coefficient in the 126 countries on the World Bank’s list is 40.8—exactly the same as the rate in the United States, but almost all the countries with higher levels of inequality than the United States are much poorer. China’s Gini is about 47. Other countries in the mid and upper 40s are Malaysia, Mexico, Nigeria, the Philippines, Uganda, and Venezuela. Among the highest in the world are many nations in Latin America and Africa, with Bolivia, Botswana, Brazil, Colombia, Haiti, and South Africa near 60. Topping the chart is Namibia in southwest Africa at 74.
Ironically, the Gini index for the world as a whole— estimated to be between 56 and 66—is almost higher than for any single country, since rich people tend to live with other rich people, fairly equally in rich countries, and poor people tend to live with other poor people, fairly equally in poor countries.
From 1970 to 2005, the Gini index for the United States rose almost 6 points. The leading explanation for this rising inequality in the United States is technological changes that have boosted the demand for skilled labor relative to unskilled labor. Gini indexes for wealth tend to be much higher than for income, but consumption Ginis are noticeably lower.
In practice there are a number of problems in calculating and interpreting Gini indexes. First, defining the units of analysis can be difficult. Does income include only monetary income or nonmonetary income such as health insurance and food stamps? A broader definition is probably better, but dollar values of nonmonetary totals are open to debate, so these are often omitted from official figures. Is the household or the individual the appropriate level of analysis? Since income is shared within households, the income Gini is usually calculated at this level, but this leads to some anomalies that skew the statistic. For example, in the United States poor households tend to be smaller than rich households. Thus, the poorest 20 percent of households contains only about 15 percent of people, while the richest 20 percent contains about 24 percent of people.
Each country collects its data differently, making comparisons difficult—although the levels and patterns reported above are generally believed to be approximately correct. Economies with similar incomes and Gini coefficients can still have very different income distributions. This is because the Lorenz curves can have different shapes and yet still yield the same Gini coefficient.
As an extreme example, an economy where half the households have no income and the other half share income equally has a Gini index of 50, but an economy with complete income equality, except for one wealthy household that has half the total income, also has a Gini index of 50.
There is no consensus on the optimal Gini index. The ideal will vary across individuals, cultures, and time. Most analysts agree that a certain degree of economic inequality is inevitable and desirable to give individuals the incentive to obtain skills, work hard, and undertake economic risks. However, if the disparity gets too great, the inequality it represents can tear apart the fabric of society.
Figure. 1 The Gini index equals 100 times the ratio of the area inside the Lorenz curve to the area under the line of perfect equality.
Bibliography:
- Gianni Betti and Achille Lemmi, Advances on Income Inequality and Concentration Measures (Routledge, 2008);
- Philip Nel, The Politics of Economic Inequality in Developing Countries (Palgrave Macmillan, 2008);
- Robert Rector and Rea Hederman, Jr., “Two Americas: One Rich, One Poor? Understanding Income Inequality in the United States,” Heritage Foundation Backgrounder (n.1791, 2004);
- Bradley R. Schiller, The Economics of Poverty and Discrimination (Pearson/Prentice Hall, 2008).
This example Gini Index Essay is published for educational and informational purposes only. If you need a custom essay or research paper on this topic please use our writing services. EssayEmpire.com offers reliable custom essay writing services that can help you to receive high grades and impress your professors with the quality of each essay or research paper you hand in.
See also:
ORDER HIGH QUALITY CUSTOM PAPER

Always on-time

Plagiarism-Free

100% Confidentiality
Special offer!
